Ethereum price consolidates before ETH bounces back to $3,300

Ethereum price may continue to drop lower to discover crucial levels of support before moving higher. ETH will face multiple tough hurdles before the token attempts to tag the upper boundary of the governing technical pattern at $3,272.
Ethereum price tests critical levels of support
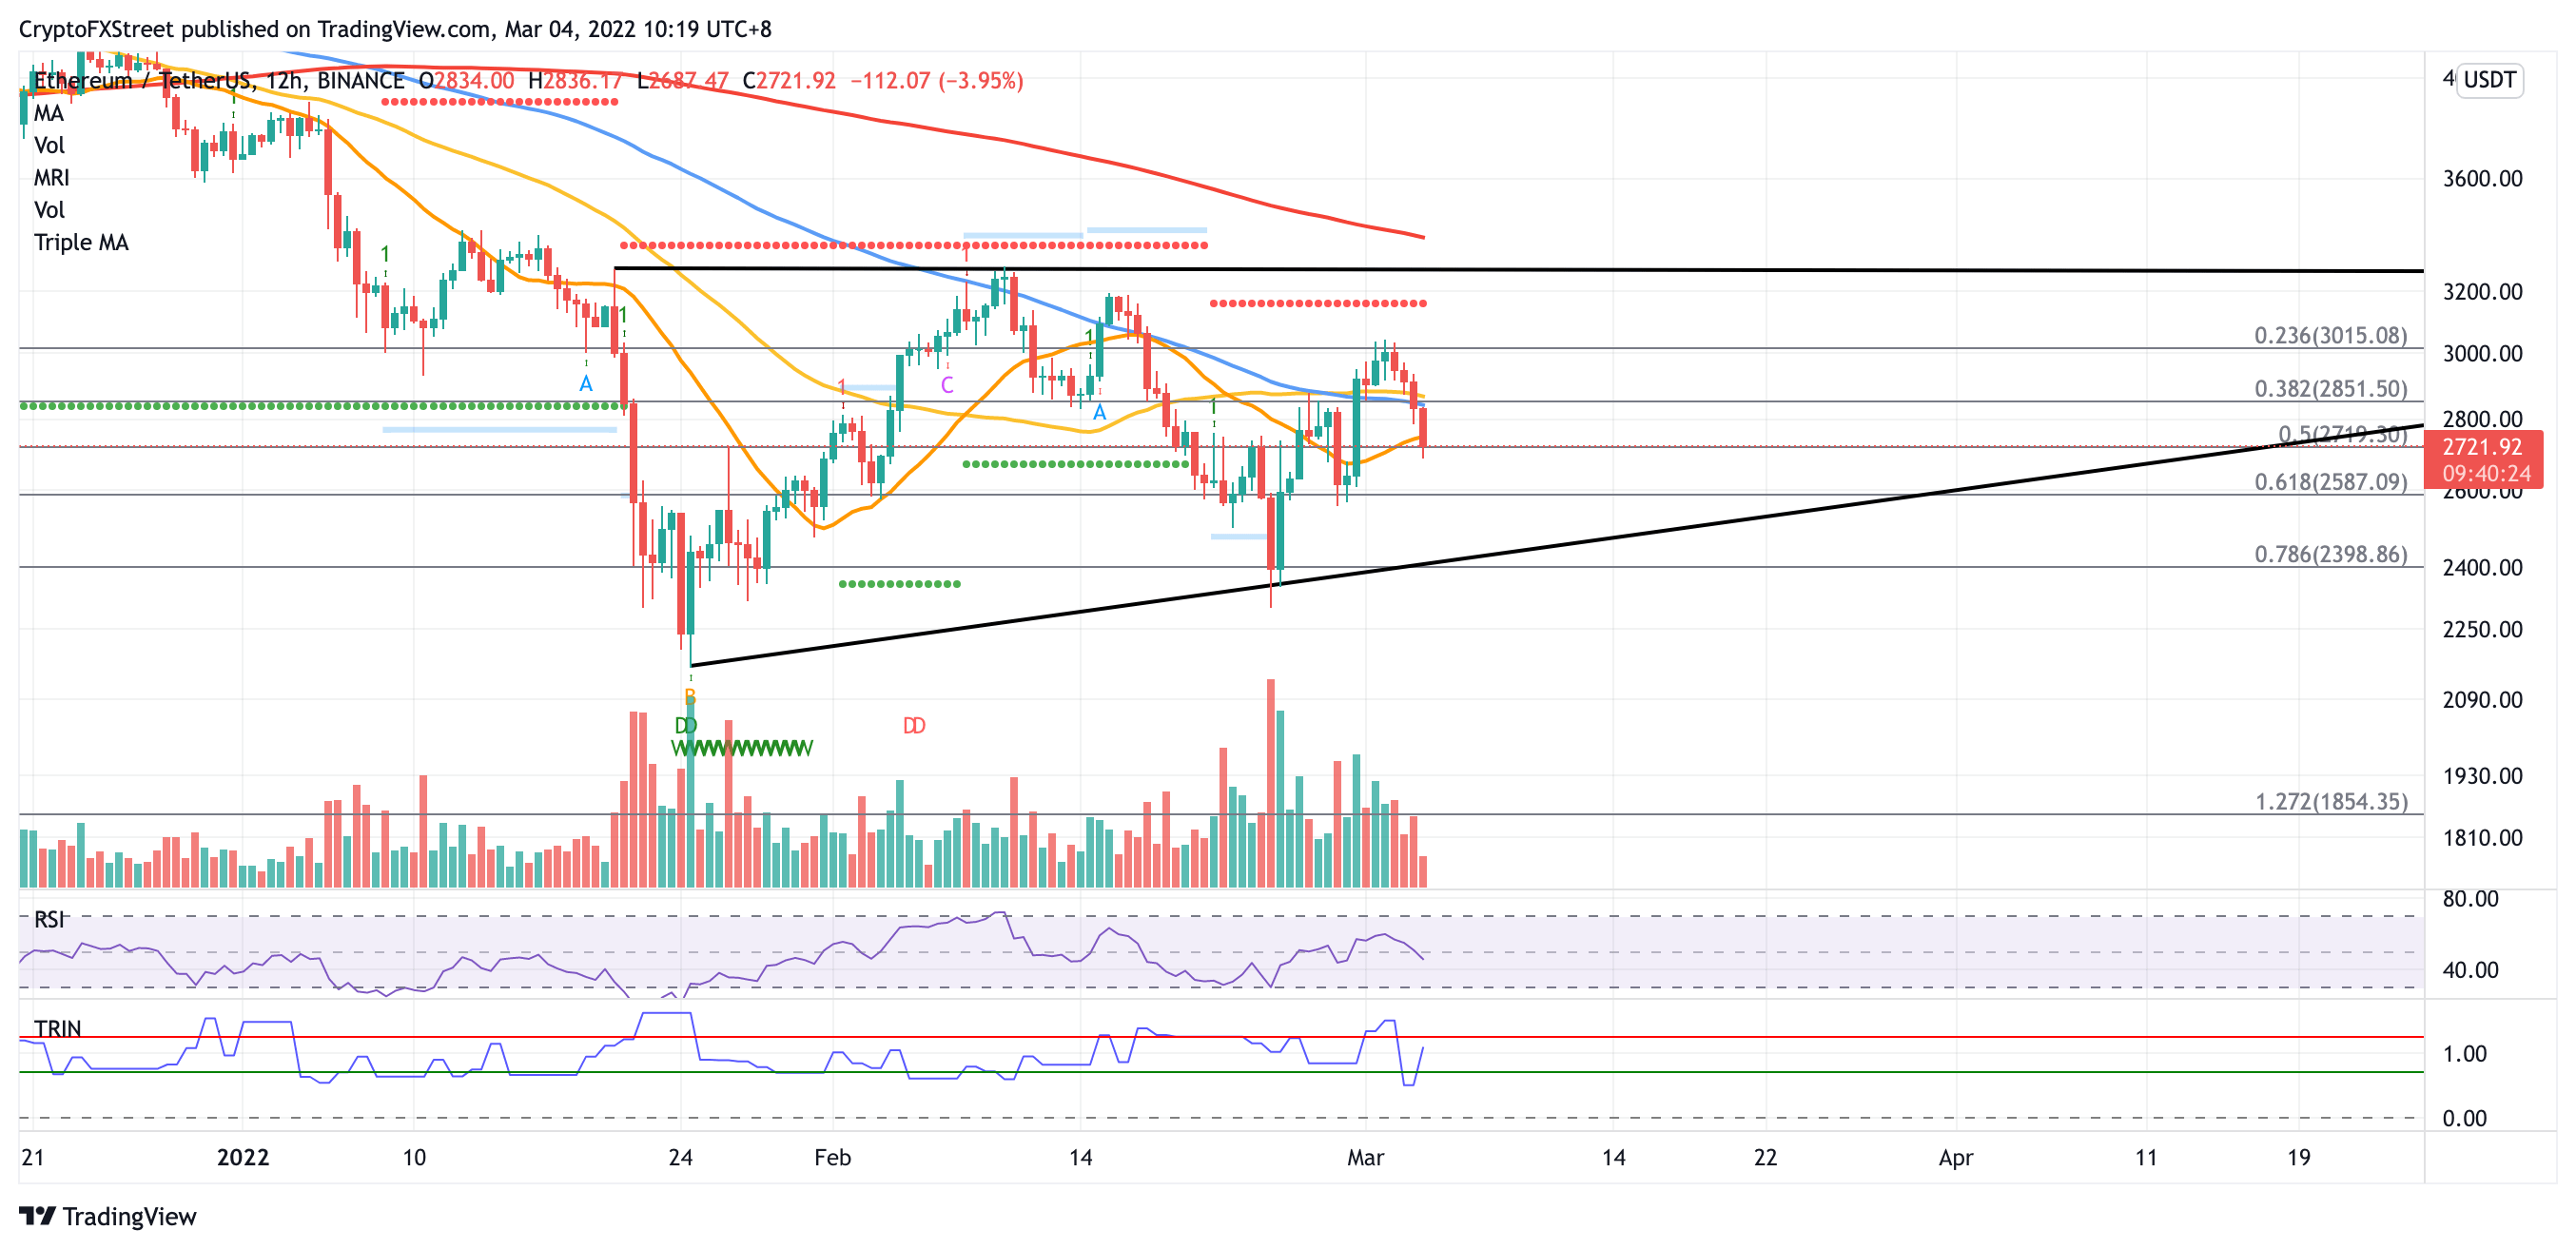
Ethereum price has formed an ascending triangle pattern on the 12-hour chart, suggesting a long-term bullish outlook. However, momentum has shifted to the downside, and ETH may slide lower to test multiple levels of support.
The first line of defense is at the 50% retracement level at $2,719, then at the 61.8% Fibonacci retracement level at $2,587.
An additional foothold will emerge at the lower boundary of the prevailing chart pattern at $2,398, intersecting with the 78.6% Fibonacci retracement level.
Further selling pressure may incentivize the sellers to slice below the downside trend line of the governing technical pattern, the long-term optimistic outlook may be invalidated.
However, if buying pressure increases, Ethereum price may face immediate resistance at the 21 twelve-hour Simple Moving Average (SMA) at $2,747.

ETH/USDT 12-hour chart
Ethereum price will face its toughest challenge at $2,851 next, where the 50 twelve-hour SMA, 100 twelve-hour SMA and the 38.2% Fibonacci retracement level intersect.
If a spike in buy order occurs, Ethereum price may climb higher toward the 23.6% Fibonacci retracement level at $3,015. An increase in bullish sentiment may push ETH higher toward the resistance line given by the Momentum Reversal Indicator (MRI) at $3,156 before the token tags the upper boundary of the prevailing chart pattern at $3,272.
Slicing above the topside trend line of the governing technical pattern will put another 33% climb for Ethereum price on the radar toward $4,372.