Bitcoin (BTC) Price Analysis for August 11

The market keeps trading sideways, according to the CoinMarketCap ranking.

Top coins by CoinMarketCap
BTC/USD
The rate of Bitcoin (BTC) has declined by 0.33% over the last 24 hours.

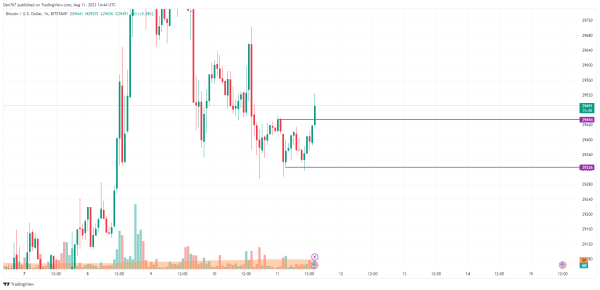
Image by TradingView
Despite the slight drop, the rate of Bitcoin (BTC) is looking bullish on the hourly chart as the price has broken the resistance at $29,454. If buyers can hold the rate above that mark, bulls might seize the initiative that can lead to a test of the $29,600 zone tomorrow.

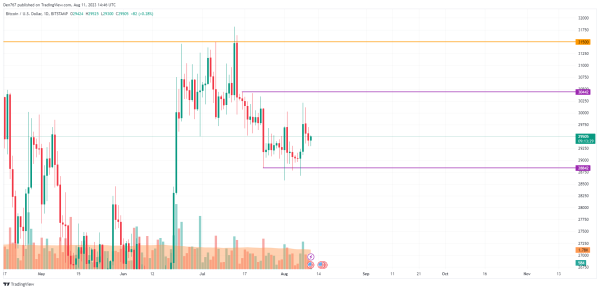
Image by TradingView
On the daily time frame, the situation is less positive, as the rate of BTC is not ready yet for a continued upward move. Bulls may start thinking about a possible midterm reversal only if prices return to the $30,000 zone and fix above it.

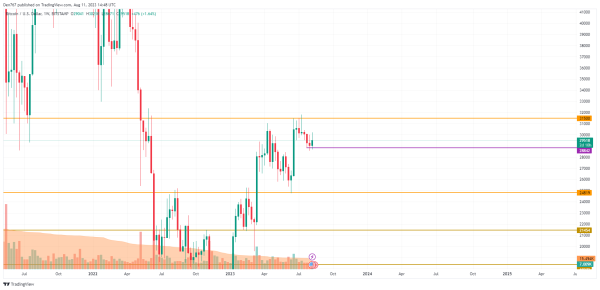
Image by TradingView
A similar situation can be seen on the weekly chart, as the price has once again bounced off the support level at $28,842. The volume remains low, which means that the price of BTC has not accumulated enough energy for a further move.
In this case, ongoing consolidation in the area of $29,000-$30,000 is the more likely scenario until the end of the month.
Bitcoin is trading at $29,511 at press time.